Integrating GPS tracking hardware with data visualisation tools design to map movement distribution
SUMMARY
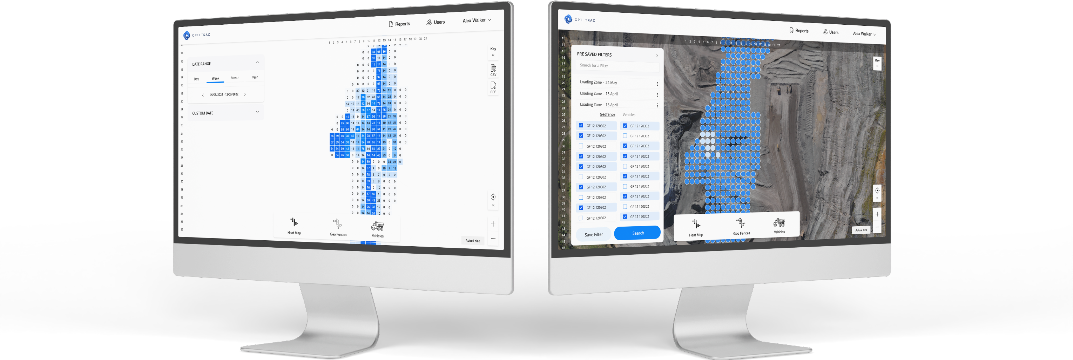
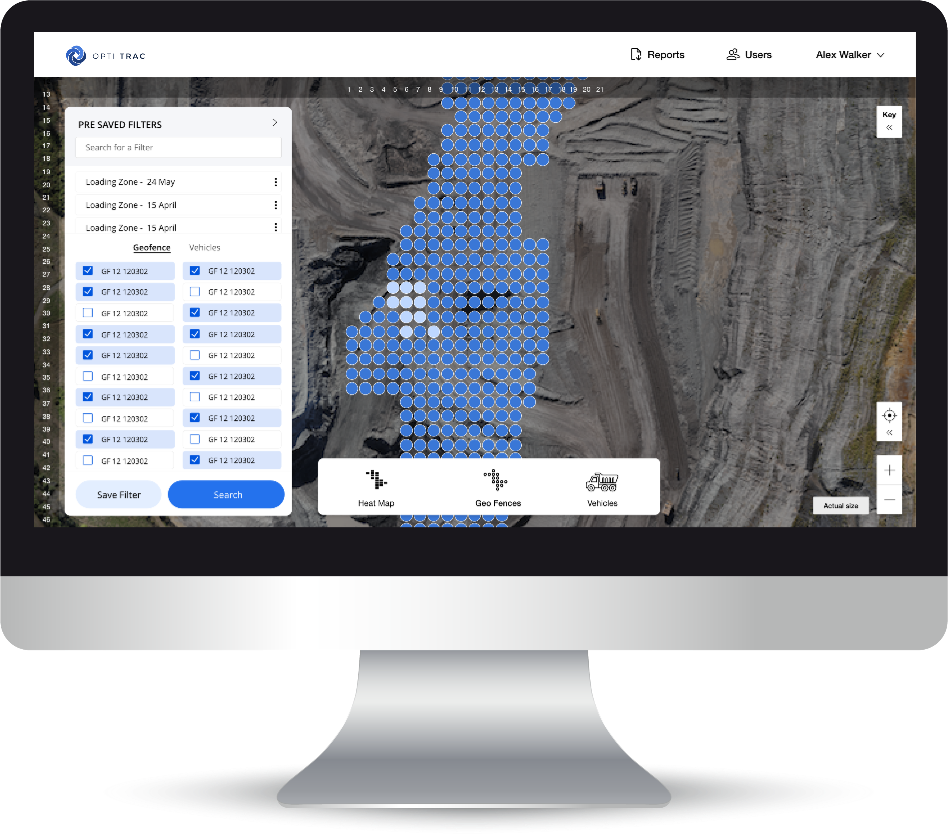
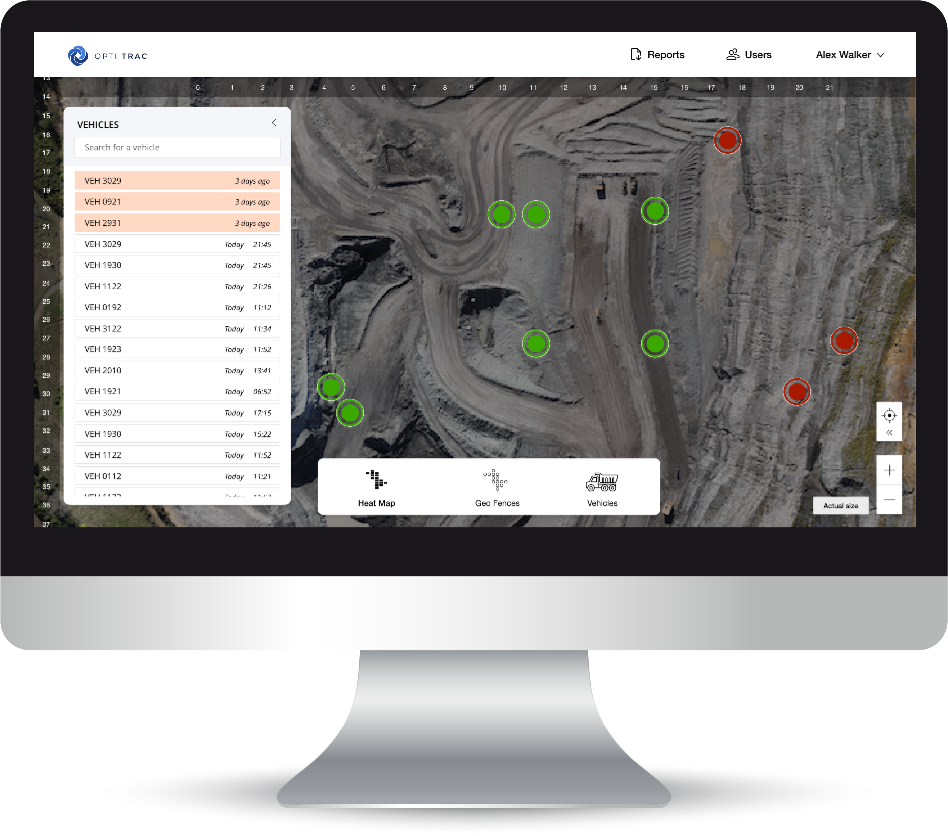
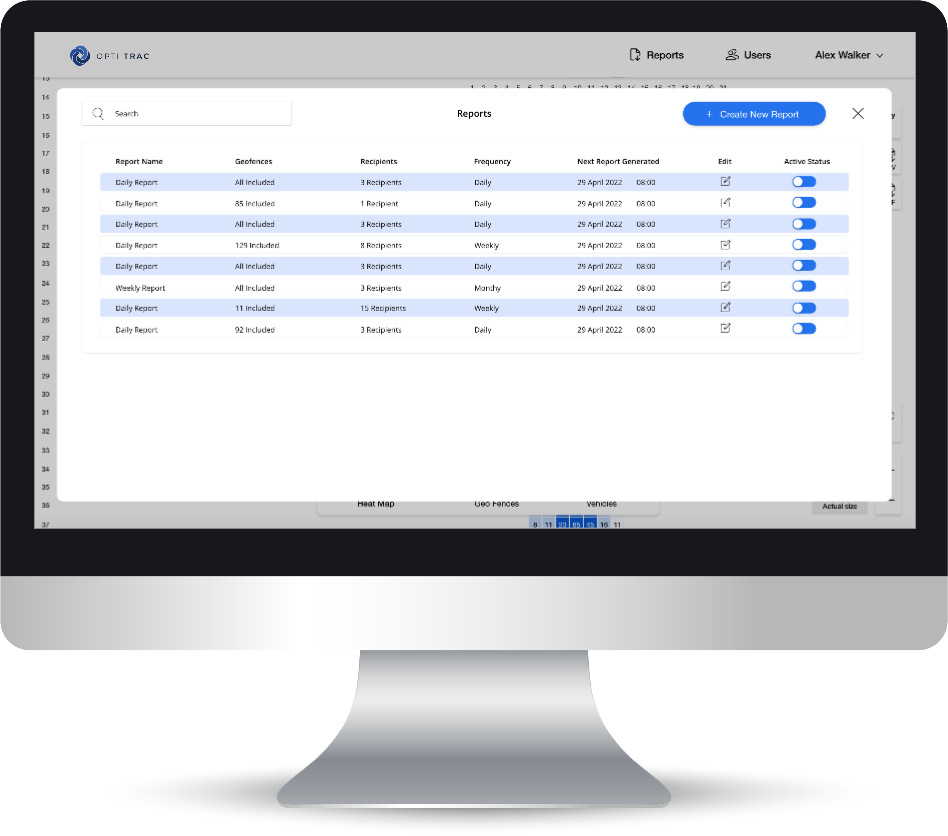
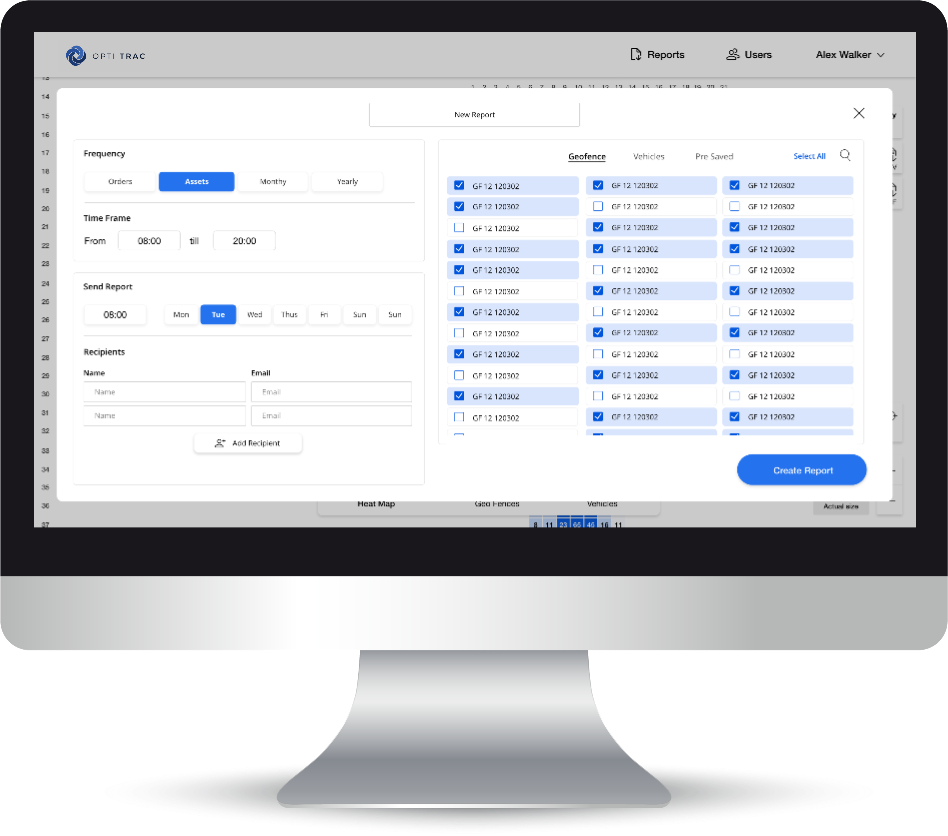
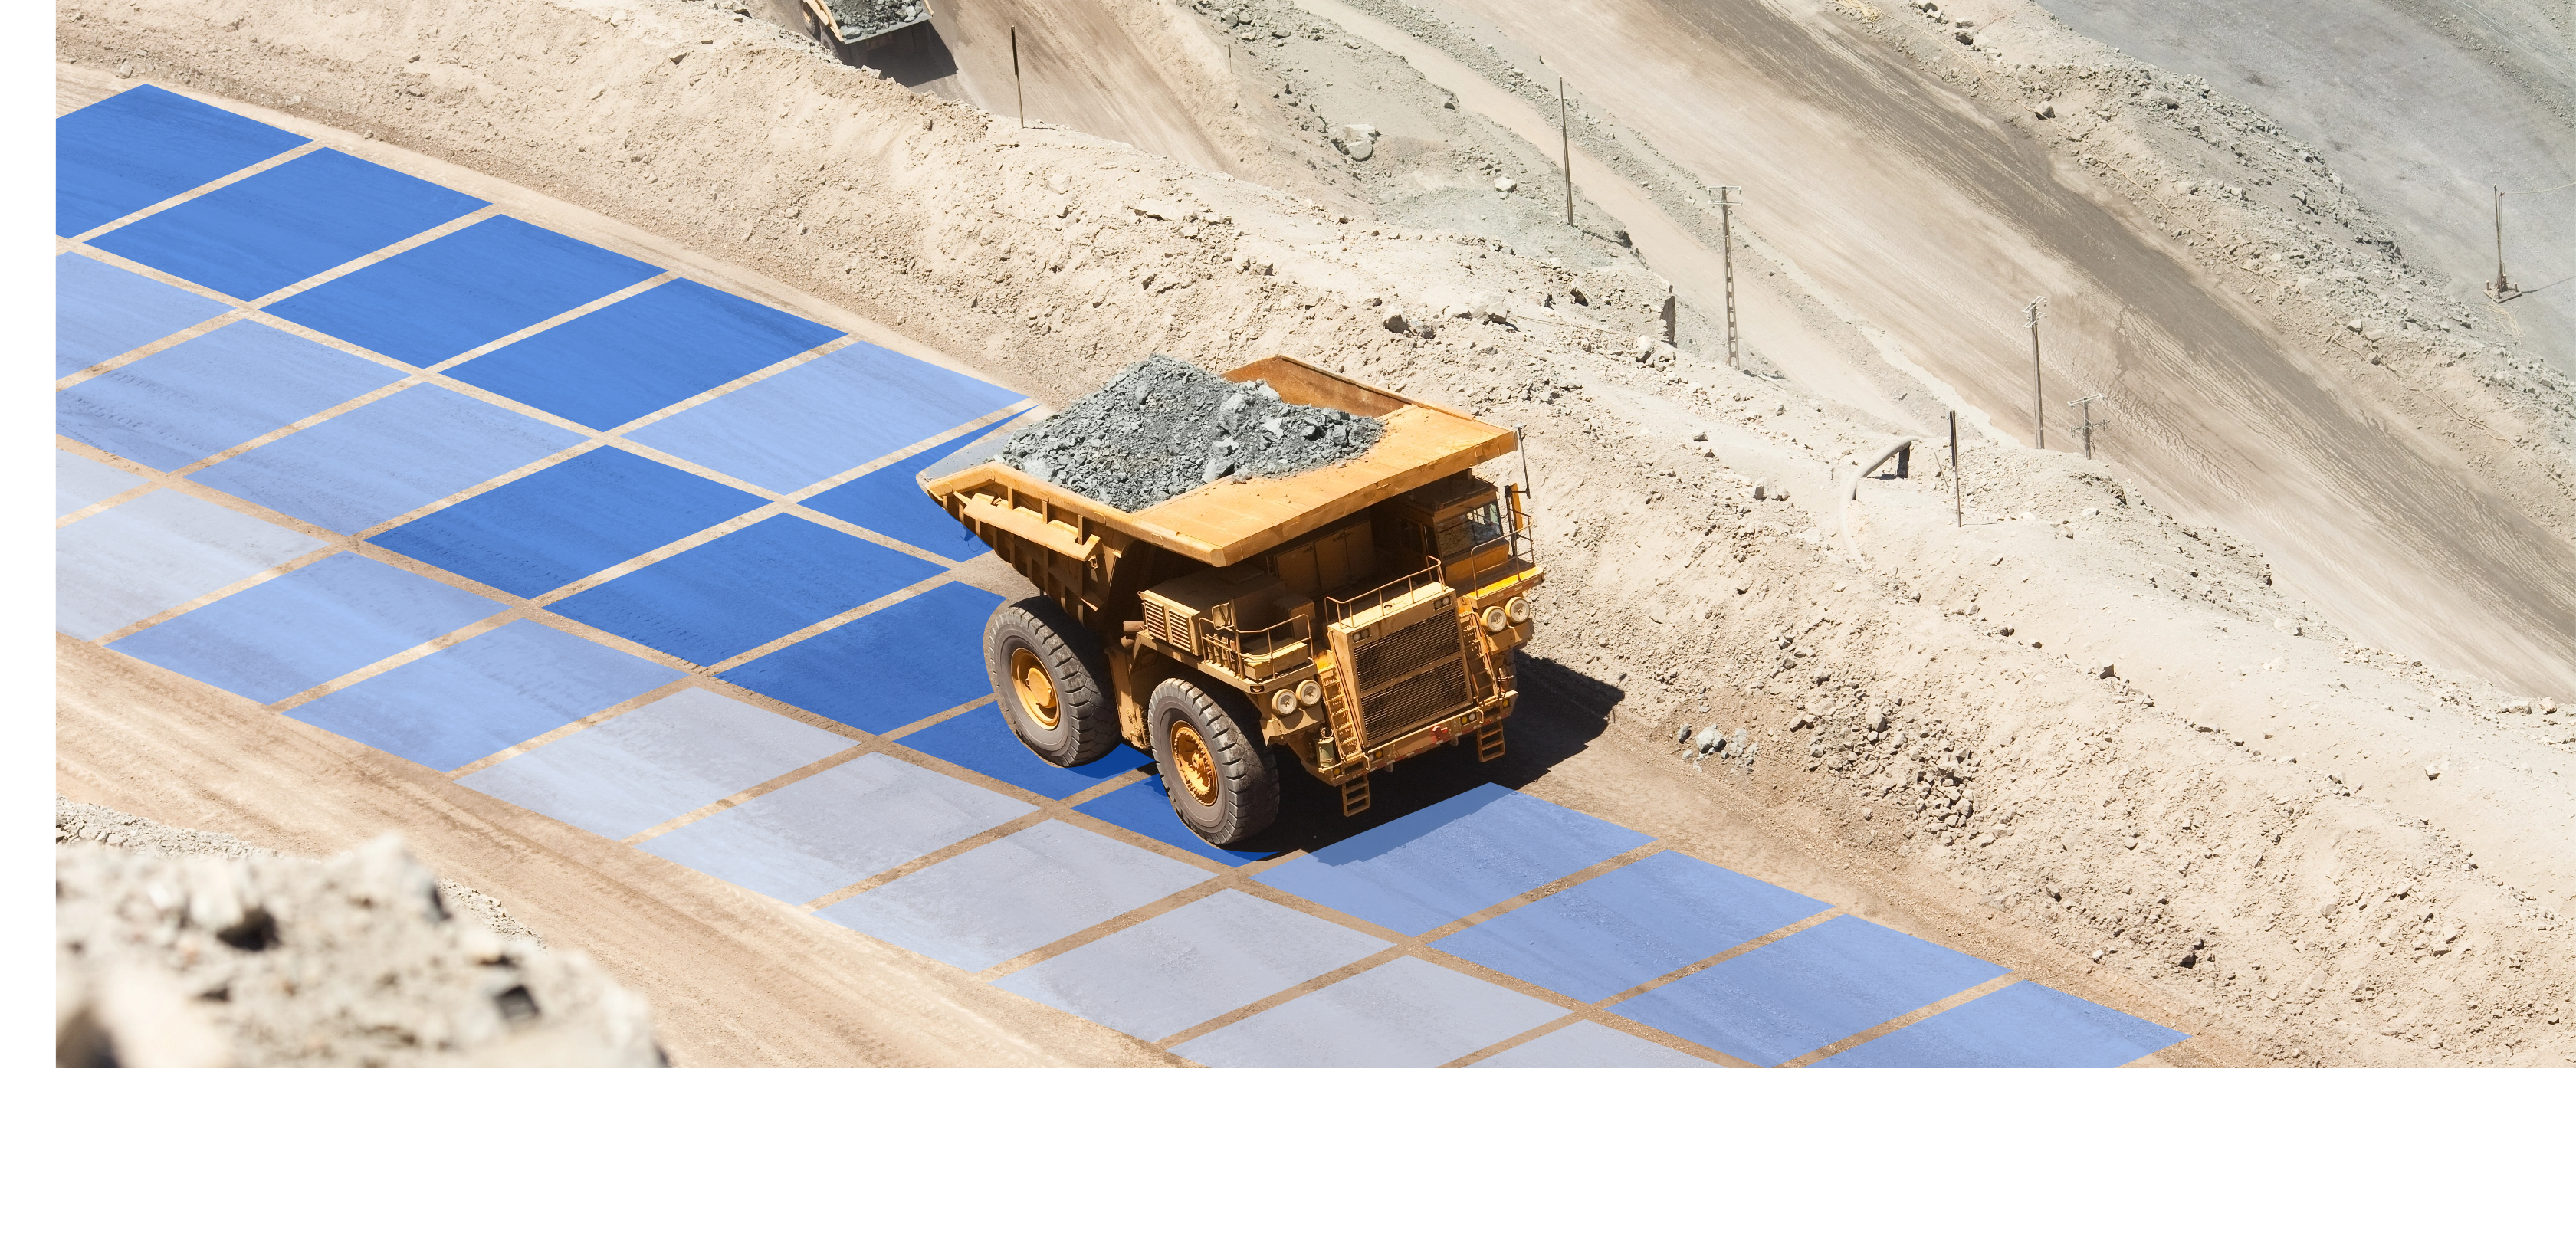
The solution combines geofence hardware with digital visualisation to monitor, records and report truck movements across a construction area.
SPECIALISTS
Research
UX/UI Design
Development
Support
OUTCOME
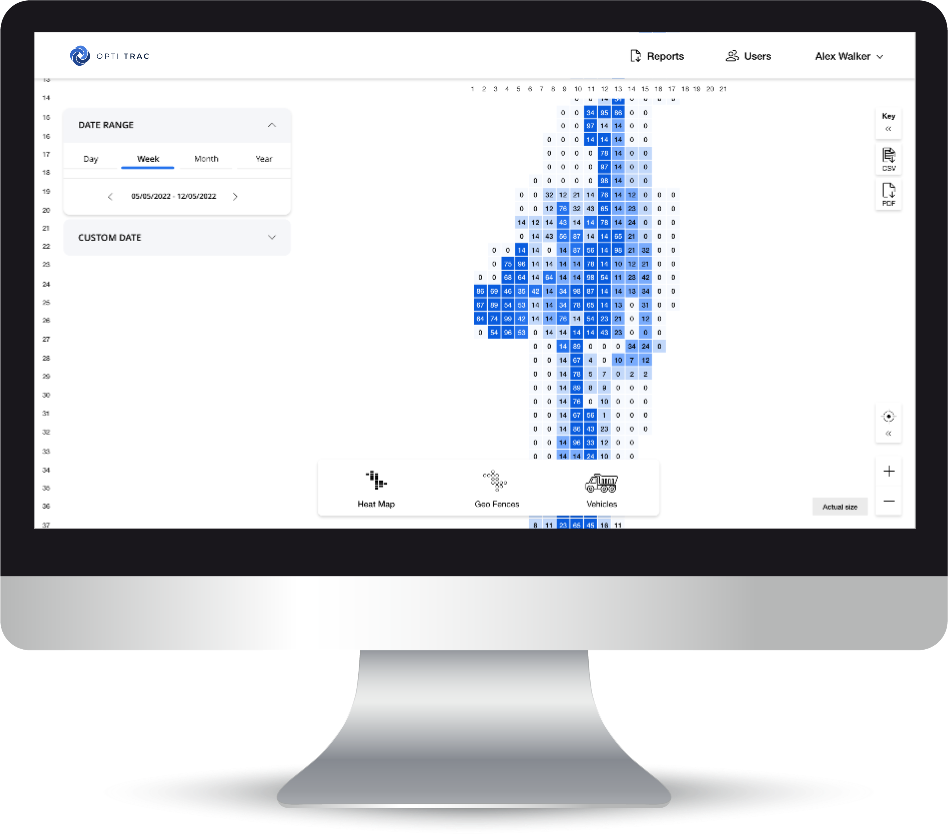
Movement data across geofences is fed from GPS’s to the application and visualised as a heat map. Real-time data allows the organisation to make immediate changes to operator movements to ensure an even distribution of movement across the mapped area. Raw date is consolidated into daily counts truck movement across pre-defined areas.
We use cookies to ensure that we give you the best experience on our website. If you continue to use this site we will assume that you are happy with it.